To run a successful business, you need to understand your numbers.
The same goes for the hospitality industry — every decision in a hotel, from pricing to guest experience, depends on data. That’s where hotel KPIs come in. They help you track revenue, performance, and operations in real time.
The logic is simple: if you can’t measure it, you can’t improve it.
Hotel KPIs allow hoteliers to evaluate performance, optimize efficiency, and boost profitability. These metrics cover everything from daily operations and financial results to marketing and customer satisfaction.
When you understand how and why to use these metrics, you can steer your hotel business in the right direction, making smarter decisions and staying competitive in a fast-changing market.
Below, we’ve compiled a comprehensive list of the most important KPIs every hotelier should monitor closely.
What are Hotel KPIs?

Hotel industry KPIs are directly tied to business goals. They represent measurable data points that help hoteliers assess how well their properties perform over time and compared to competitors.
Whether it’s a luxury resort, boutique property, or business hotel, tracking the right metrics allows management to evaluate performance, monitor marketing success, and forecast future growth.
Owners, managers, and department heads use these insights to improve efficiency, identify market trends, and make informed decisions that strengthen overall profitability.
Revenue & Pricing Metrics

Revenue and pricing metrics show how effectively a hotel earns from rooms and other services. They reveal pricing performance, demand trends, and revenue opportunities. Tracking these metrics helps hotels adjust rates strategically and maximize profitability.
1. Average Daily Rate (ADR)
Average Daily Rate (ADR) measures the average revenue earned per occupied room within a specific period. It’s an essential metric for assessing a hotel’s pricing performance and demand strength.
Tracking ADR trends helps hoteliers refine their pricing strategies in response to seasonality, special events, or changing market conditions.
For example, in March 2024, hotels in Singapore recorded an ADR of SGD 358.91, a 12.7% year-on-year increase during Taylor Swift’s six-night Eras Tour. The event showed how strategic yield management can significantly raise room rates during periods of high demand.
To maintain strong ADR performance, hotels can adopt dynamic pricing models, upsell room upgrades, or offer high-value packages that combine accommodation with experiences such as spa access, breakfast, or local tours.
Targeting profitable guest segments, including business travelers or long-stay guests, can also help improve average rates without affecting occupancy.
Formula: ADR = Total Room Revenue ÷ Rooms Sold
Example:
- Total Room Revenue: $15,000
- Rooms Sold: 50
- ADR = $15,000 ÷ 50 = $300
In this case, the hotel earns an average of $300 per room sold, helping management understand its pricing performance for that day.
PROFPAR (Profit per Available Room)
PROFPAR focuses on profitability rather than just revenue. It shows how much profit each room generates after operating expenses, giving hotel managers a clearer view of financial performance.
This metric helps identify inefficiencies in areas like staffing, utilities, and maintenance that may reduce profits even when occupancy and ADR are high.
To improve PROFPAR, hotels can streamline operations, optimize energy use, and negotiate better supplier rates.
Increasing ancillary revenue through restaurants, events, or spa services also helps raise profit per room, ensuring each booking contributes meaningfully to overall profitability.
Formula: PROFPAR = (Total Revenue – Operating Expenses) ÷ Rooms Sold
Example:
- Total Revenue: $50,000
- Operating Expenses: $20,000
- Rooms Sold: 100
- PROFPAR = ($50,000 – $20,000) ÷ 100 = $300
In this example, the hotel earns an average of $300 profit per room sold after covering its operating costs.
NRevPAR (Net Revenue per Available Room)
NRevPAR provides a more realistic picture by accounting for commissions and distribution costs. It helps hotels see how much revenue they actually retain after fees from online travel agencies (OTAs), credit cards, and third-party platforms. This KPI is essential for evaluating the profitability of each booking channel.
Hotels can improve NRevPAR by reducing reliance on high-commission OTAs, encouraging direct bookings through loyalty programs, and bundling value-added offers that attract higher-margin guests.
Regularly monitoring channel performance ensures the most cost-effective mix of revenue sources.
Formula: NRevPAR = Net Room Revenue ÷ Rooms Sold
Example:
- Net Room Revenue: $40,000
- Rooms Sold: 100
- NRevPAR = $40,000 ÷ 100 = $400
In this case, the hotel earns $400 in net revenue per room sold after accounting for all distribution-related costs and commissions.
RevPAR Room Type Index (ReRTI)
The RevPAR Room Type Index (ReRTI) compares revenue performance among different room categories. It shows which room types outperform the hotel’s average and which may need adjustments in pricing, marketing, or presentation.
By analyzing ReRTI, managers can identify their highest-yield segments and better allocate inventory during high-demand periods.
A higher ReRTI means a room type is generating more revenue than the property’s average, while a lower one signals untapped potential. Hotels can use this insight to fine-tune rates, enhance amenities, or reposition rooms to better match guest preferences.
Formula: ReRTI = (RevPAR of Room Type ÷ Overall RevPAR) × 100
Example:
- RevPAR of Deluxe Rooms: $150
- Overall Hotel RevPAR: $120
- ReRTI = ($150 ÷ $120) × 100 = 125
In this example, deluxe rooms generate 25% more revenue per available room than the property’s overall average, suggesting strong pricing and guest demand for that category.
2. Revenue per Available Room (RevPAR)
Revenue per Available Room (RevPAR) is one of the most important performance metrics in the hotel industry. It combines occupancy and pricing to show how efficiently a hotel generates revenue from its available rooms.
RevPAR helps managers assess the balance between room rates and occupancy, whether a hotel is filling rooms at the right price to maximize income.
A consistent rise in RevPAR indicates strong demand and effective rate management, while a drop can signal that either pricing is too low or occupancy has declined.
Hoteliers use RevPAR to compare performance over time, evaluate marketing effectiveness, and benchmark against competitors. By monitoring this metric, managers can identify market trends, plan rate adjustments, and improve financial outcomes.
RevPAR also helps reveal strategic opportunities, such as when to promote packages, optimize distribution channels, or shift focus toward high-value guests.
Formula:
RevPAR = ADR × Occupancy Rate
(or)
RevPAR = Total Room Revenue ÷ Total Rooms Available
Example:
- Average Daily Rate (ADR): $150
- Occupancy Rate: 80%
- RevPAR = $150 × 0.80 = $120
Here, the hotel earns an average of $120 per available room, showing how pricing and occupancy together influence overall performance.
3. Total Revenue per Available Room (TRevPAR)
Total Revenue per Available Room (TRevPAR) gives a complete view of a hotel’s financial performance by including all revenue streams, not just room sales.
It covers income from dining, spa services, events, parking, and other amenities, helping managers assess how effectively the property generates income overall.
A 2024 report showed that hotels in the Americas recorded a 15.6% increase in TRevPAR compared to the previous year. The rise reflected the impact of non-room services such as restaurants, events, and wellness facilities on total revenue.
Tracking TRevPAR helps hotel teams understand their total revenue potential and make better decisions on benchmarking, resource allocation, and planning.
When certain areas, like food and beverage or wellness, perform strongly, management can focus on them to further improve profitability. Enhancing guest satisfaction and encouraging on-site spending also helps increase TRevPAR.
Formula: TRevPAR = Total Revenue ÷ Rooms Available
Example:
- Total Revenue: $500,000
- Rooms Available: 100
- TRevPAR = $500,000 ÷ 100 = $5,000
In this case, the hotel earns $5,000 per available room from all sources, including rooms, dining, spa, and other hotel services.
4. Gross Operating Profit per Available Room (GOPPAR)
Gross Operating Profit per Available Room (GOPPAR) measures the profit a hotel earns after covering operating expenses, such as payroll and maintenance.
It shows how efficiently the property converts total revenue into profit and helps managers evaluate overall financial performance.
Hotels can strengthen GOPPAR by managing labor, energy, and supply costs more effectively while finding new ways to increase revenue through dining, spa services, and events.
Balancing cost control with diversified income streams helps maintain consistent profitability across all departments.
Formula: GOPPAR = Gross Operating Profit ÷ Rooms Available
Example:
- Gross Operating Profit: $50,000
- Rooms Available: 100
- GOPPAR = $50,000 ÷ 100 = $500
The hotel earns $500 profit per available room after all operating expenses are covered.
GOPPAR measures a hotel’s real profitability. Regular evaluation ensures efficient spending, stable operations, and long-term financial health.
5. Revenue per Available Market (RevPAM)
Revenue per Available Market (RevPAM) shows how efficiently a hotel generates income across its property. It includes revenue from rooms, restaurants, spas, meeting areas, and other facilities, helping management assess how each space contributes to total revenue.
This metric helps identify underused areas and uncover new income opportunities. Meeting rooms can host corporate events, restaurants can offer private dining, and outdoor spaces can be transformed into venues for gatherings.
Evaluating these areas allows hotels to plan more strategically and improve total profitability.
Formula: RevPAM = Total Property Revenue ÷ Total Available Market Units
Example:
- Total Property Revenue: $100,000
- Market Units (sq. meters or rentable spaces): 500
- RevPAM = $100,000 ÷ 500 = $200
The hotel earns $200 per market unit, showing how efficiently it uses its spaces to generate revenue.
6. Cost per Occupied Room (CPOR)
Cost per Occupied Room (CPOR) shows the cost of operating each occupied room. It includes daily expenses such as labor, housekeeping, and utilities, helping hotels assess how efficiently they manage resources and whether spending aligns with revenue.
A lower CPOR indicates stronger cost control and higher operational efficiency. Hotels can reduce expenses by effectively managing staff schedules, optimizing energy use, and minimizing waste.
Reviewing CPOR over time helps reveal spending patterns and maintain service quality without unnecessary costs.
Formula: CPOR = Total Operating Costs ÷ Occupied Rooms
Example:
- Total Operating Costs: $15,000
- Occupied Rooms: 100
- CPOR = $15,000 ÷ 100 = $150
Each occupied room costs $150 to operate, covering expenses like cleaning, maintenance, and utilities.
Occupancy and Stay Metrics
These KPIs show how well a hotel fills its rooms and retains guests. Monitoring occupancy and stay trends helps balance pricing, staffing, and marketing to maintain strong performance across seasons.
1. Occupancy Rate
Occupancy Rate shows the percentage of available rooms sold during a specific period. It indicates market demand and helps hotels assess how effectively they’re using their room inventory.
A higher occupancy rate suggests stable demand, while lower levels may signal issues related to pricing, promotions, or competition. Studying occupancy trends allows hotels to adjust rates and marketing strategies in line with seasonal changes.
Location, pricing models, and event timing all influence occupancy, so maintaining flexibility helps achieve steady results throughout the year.
Many hotels use dynamic pricing and targeted offers to balance demand across peak and off-peak seasons. In 2024, global hotel occupancy was projected to reach 63.6%, with ADR and RevPAR also rising as the market continues to recover.
Formula: Occupancy Rate = (Rooms Sold ÷ Rooms Available) × 100
Example:
- Rooms Sold: 80
- Rooms Available: 100
- Occupancy Rate = (80 ÷ 100) × 100 = 80%
An occupancy rate of 80% shows efficient use of available rooms and clear demand visibility. It also allows for more accurate forecasting of staffing and amenities, helping maintain consistent service quality.
2. Average Length of Stay (ALOS)
Average Length of Stay (ALOS) shows how long guests stay on average and helps hotels balance operations and profitability. Longer stays generally reduce housekeeping costs and improve forecast accuracy.
A longer average stay often indicates higher guest satisfaction, as guests who feel comfortable and valued tend to extend their visits.
Hotels can increase ALOS by offering extended-stay discounts, loyalty perks, or curated experiences that encourage guests to explore more of the property and destination.
Adjusting amenities and marketing to attract business travelers, families, or vacationers can also influence stay duration and strengthen guest loyalty.
Formula: ALOS = Total Room Nights ÷ Total Bookings
Example:
- Total Room Nights: 500
- Total Bookings: 200
- ALOS = 500 ÷ 200 = 2.5 nights
Guests stay an average of 2.5 nights, showing steady engagement. Hotels can raise this figure through bundled offers, personalized itineraries, or local experiences that encourage guests to extend their visit.
Guest and Employee Experience Metrics
These KPIs focus on the human side of hospitality. Tracking satisfaction and loyalty helps hotels understand how both employees and guests feel about their experiences and how that directly impacts performance, service quality, and long-term success.
1. Employee Metrics
Employee metrics evaluate how effectively a hotel manages and supports its staff. They cover satisfaction, retention, training, and productivity, helping management monitor workforce stability and performance.
When employees feel valued and aligned with service goals, operations run smoothly, and guests enjoy a better overall experience.
Employee Satisfaction and Retention
Employee satisfaction and retention describe how engaged and committed hotel staff are to their work. Measuring satisfaction through surveys, turnover rates, and feedback interviews helps determine whether employees feel valued and supported.
High engagement leads to better service delivery, improved efficiency, and a more positive guest experience. Hotels that invest in staff training, recognition, and career growth paths often achieve stronger retention and consistent service quality across departments.
Formula: Employee Retention Rate = ((Total Employees – Employees Who Left) ÷ Total Employees) × 100
A retention rate above 85% typically indicates a healthy work environment and strong employee loyalty.
Measuring Impact on Operations and Guest Experience
Employee engagement directly influences how well hotel operations run. When teams feel motivated and confident in their roles, guest interactions become smoother, faster, and more genuine.
Monitoring this connection between workforce morale and service quality allows managers to make data-driven improvements to both staff culture and customer satisfaction.
2. Customer Experience Metrics
Customer experience metrics show how guests feel about their stay and the quality of service they receive. These indicators include satisfaction, loyalty, and overall sentiment, offering insights into factors that influence repeat bookings and positive reviews.
Strong guest experience performance helps hotels build trust, attract new visitors, and build lasting customer loyalty.
Customer Satisfaction Score (CSAT)
The Customer Satisfaction Score (CSAT) reveals how happy guests are with their stay. Hotels can collect feedback through surveys or digital tools at different touchpoints, from check-in to post-stay.
A high CSAT indicates that guests feel their expectations are being met. Even small improvements in cleanliness, communication, or amenities can raise satisfaction levels and enhance the guest experience.
Formula: CSAT = (Number of Satisfied Responses ÷ Total Responses) × 100
A CSAT score above 85% signals strong service consistency and guest approval.
Online Reputation Score
Online reputation reflects how guests perceive the hotel across review platforms like TripAdvisor, Google, and OTAs. It summarizes public ratings, review sentiment, and social media mentions into one benchmark.
Maintaining a high reputation score builds credibility and trust. Regularly responding to reviews, resolving complaints, and highlighting guest stories can significantly improve online standing.
Loyalty Programs
Loyalty programs encourage repeat stays and long-term relationships with guests. They track engagement through reward redemptions, referrals, and member spending, providing insights into customer loyalty and retention.
Well-designed loyalty programs personalize offers and make guests feel recognized, helping build stronger relationships and increase repeat revenue. Benefits like room upgrades, discounts, or exclusive event access can help maintain loyalty over time.
Sales Conversion Rate
Sales conversion rate shows how effectively inquiries or leads turn into bookings. It helps identify friction points in the booking journey, such as unclear pricing or poor response times.
By improving communication and offering incentives for direct bookings, hotels can raise conversion rates and capture more revenue from marketing efforts.
Formula: Sales Conversion Rate = (Bookings ÷ Inquiries) × 100
Example: 30 bookings ÷ 300 inquiries × 100 = 10% conversion rate.
Cost of Acquisition (COA)
The Cost of Acquisition (COA) represents how much a hotel spends to acquire each new guest. It includes expenses like marketing, commissions, and distribution fees.
Understanding COA helps managers balance marketing budgets and focus on channels with the highest return. Reducing acquisition costs while maintaining quality directly supports profitability and sustainable growth.
Formula: COA = Total Sales & Marketing Costs ÷ Number of New Customers
Example: $125,000 ÷ 50 = $2,500 per customer
Market and Competitive Metrics
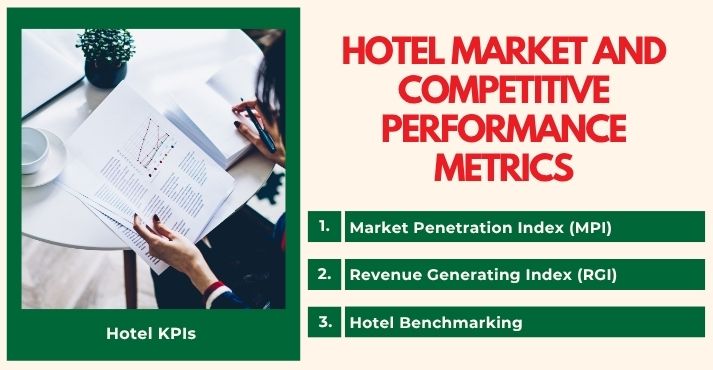
Market and competitive metrics assess how a hotel performs within its market, focusing on market share, pricing, and demand levels. These insights allow hotels to fine-tune rates, marketing, and service strategies to stay competitive.
Insights shared at trade shows featuring hospitality technology emphasize how digital systems, data analytics, and automation support these efforts, helping hotels benchmark performance, optimize pricing, and enhance their market position.
1. Market Penetration Index (MPI)
The Market Penetration Index (MPI) compares your hotel’s occupancy rate with the market average. It shows whether your property maintains a fair share of available demand.
A score above 100 means your occupancy exceeds the market average, while a score below 100 suggests room to grow your market presence.
Hotels can improve MPI by refining marketing efforts, enhancing online visibility, and aligning pricing strategies with local demand patterns.
Maintaining strong occupancy during both peak and shoulder seasons helps stabilize performance and increase market share year-round.
Formula: MPI = (Hotel Occupancy ÷ Market Occupancy) × 100
Example:
- Hotel Occupancy: 75%
- Market Occupancy: 80%
- MPI = 75 ÷ 80 × 100 = 93.75
In this case, the hotel operates below the market average, showing potential to strengthen its demand through targeted campaigns or partnerships.
2. Revenue Generating Index (RGI)
The Revenue Generating Index (RGI) compares a hotel’s RevPAR with the average RevPAR of similar properties in the same market. It helps assess how effectively pricing and occupancy strategies perform relative to direct competitors.
A higher RGI means the hotel earns more revenue per available room than comparable hotels nearby.
If RGI falls below 100, management can review rate structures, promotional offers, or market segmentation to increase room revenue and improve competitive standing.
Formula: RGI = (Hotel RevPAR ÷ Market RevPAR) × 100
Example:
- Hotel RevPAR: $120
- Market RevPAR: $100
- RGI = 120 ÷ 100 × 100 = 120
This shows the hotel is outperforming competitors, likely due to effective pricing and strong demand conversion.
3. Hotel Benchmarking
Hotel benchmarking compares KPIs like occupancy, ADR, and RevPAR against similar properties or past performance. It helps hotels identify what’s working, where costs can be reduced, and which competitors are setting higher standards.
By using industry reports or internal PMS data, hotels can analyze performance across periods or departments. Regular benchmarking supports data-driven improvement, helping managers set realistic targets and identify best practices for sustained profitability.
Conclusion
Monitoring KPIs is essential for effective hotel management. These metrics, from RevPAR and ADR to guest satisfaction and loyalty, reveal where revenue is strong and where service can improve.
By consistently measuring performance, hoteliers can make smarter decisions, refine strategies, and create experiences that enhance both profitability and guest satisfaction.
The more accurately you measure, the more confidently you can grow — one guest, one room, one metric at a time.